Giải chi tiết đề thi thật IELTS Writing 2024 – Từ Band 6.0 đến 8.5
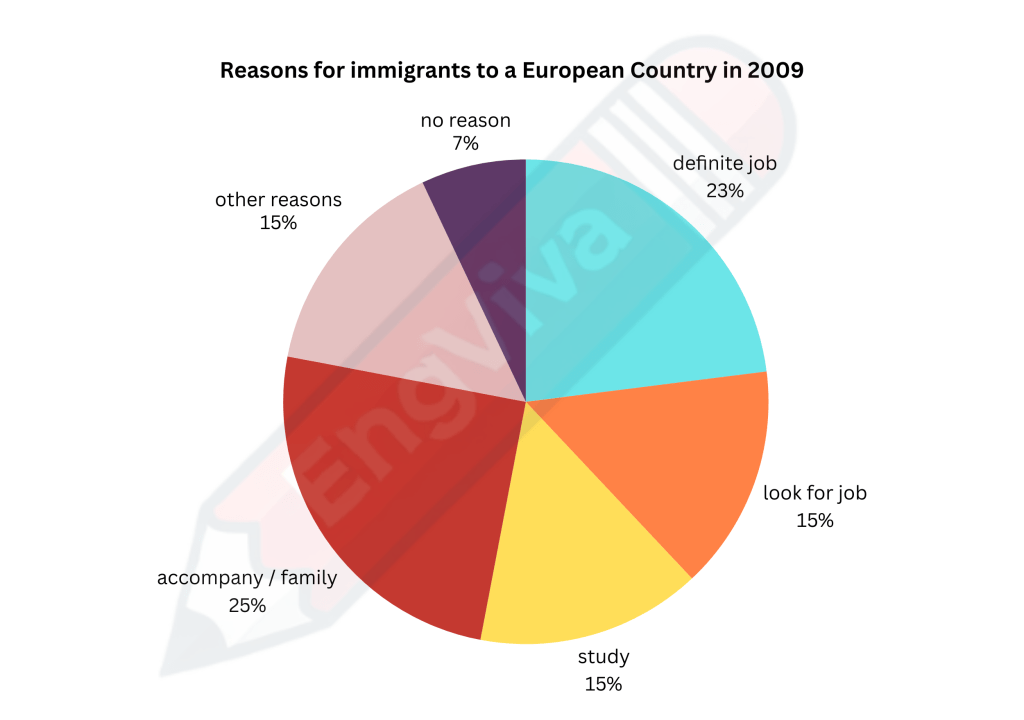
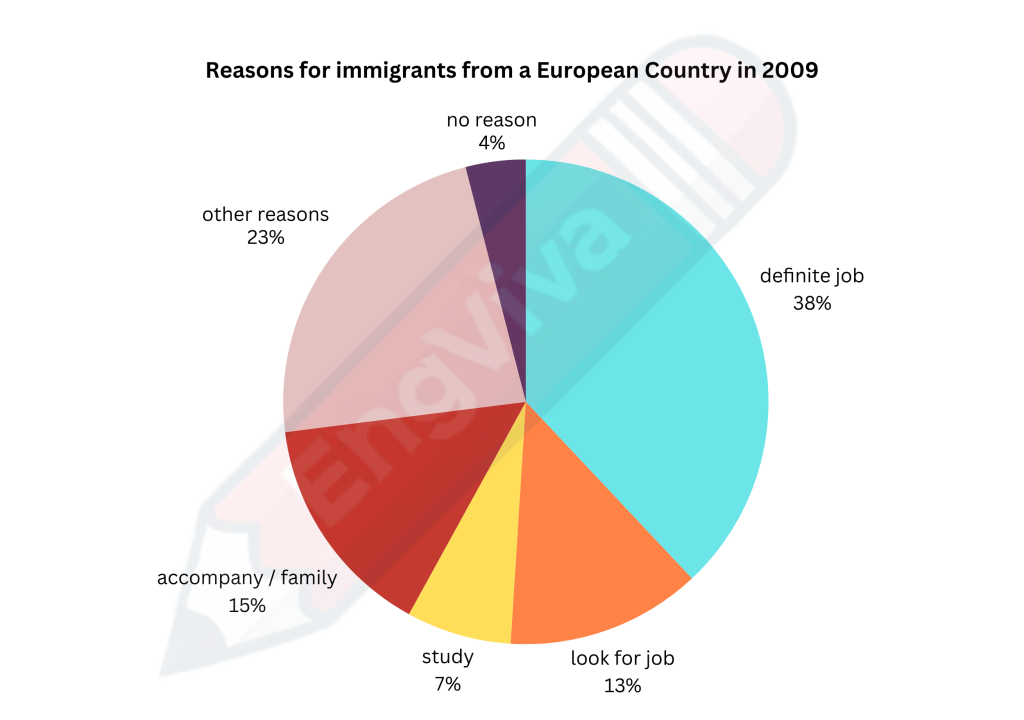
Task 1: The pie charts show the reasons for immigrants to a European
country in 2009 and reasons for immigrants from a European country in 2009.
Band 6.0-6.5:
The two pie charts illustrate the reasons for immigration to and from a European country in 2009. The most significant reason for people moving to a European country was to accompany their family, accounting for 25%. This was closely followed by the desire to secure a definite job, which made up 23%. Other reasons for immigration included studying (15%), looking for a job (15%), while 7% had no specific reason for moving.
As for people leaving a European country, the largest proportion did so for a definite job, representing 38%. Other reasons contributed to 23%, while 15% of people left to accompany their family. A smaller proportion of people left for education (7%), and 13% of people were looking for a job. Only 4% stated they had no reason for emigrating.
In general, the main reason for people immigrating to and from the European country was related to work, whether looking for or having secured a definite job. However, family reasons and study were also significant factors for both groups.
Band 7.0-7.5:
The pie charts compare the reasons behind immigration to and emigration from a European country in 2009. The most common reason for immigration was to accompany family members, comprising 25% of the total. A close second was migrating for a definite job at 23%. Reasons related to education and job hunting both accounted for 15%, while 7% of people cited no specific reason for their move.
On the other hand, the largest portion of emigrants left the European country for a definite job, with 38% choosing this option. “Other reasons” formed the second-largest category at 23%, followed by accompanying family members at 15%. A smaller percentage of people left for education (7%) or in search of a job (13%). Interestingly, 4% of those leaving provided no clear reason.
Overall, work-related factors, including job security and job seeking, dominated the reasons for both immigration and emigration. However, family and educational purposes also played significant roles.
Band 8.0-8.5:
The two pie charts illustrate the reasons for both immigration to and emigration from a European country in 2009. The primary motive for immigration was to accompany family members, representing 25% of the total. Following closely behind was the pursuit of a definite job, which accounted for 23%. Additionally, studying and seeking employment were equal contributors at 15% each, while 7% of immigrants stated they had no particular reason for their move.
Conversely, a significantly larger percentage of emigrants left the country due to securing a definite job, at 38%. “Other reasons” made up 23%, and 15% of people left to accompany family. In contrast to immigration, fewer individuals (7%) emigrated for study purposes, while 13% were actively looking for a job. A mere 4% of emigrants indicated no reason for leaving.
In conclusion, employment was the predominant driving factor for both immigration and emigration, though family ties and educational goals also significantly influenced people’s decisions. However, a greater share of emigrants left with confirmed jobs compared to those entering the country.
Here’s a breakdown of what makes the three versions (Band 6.0-6.5, Band 7.0-7.5, and Band 8.0-8.5) different in terms of structure, language, and content:
1. Band 6.0-6.5:
- Language: This version uses simpler language, straightforward sentences, and basic vocabulary. There is little variety in sentence structures, with most sentences being short or simple compound sentences.
- Details: The focus is on reporting the facts directly from the charts with minimal comparison or interpretation. The writer mentions the data but doesn’t provide deeper insight or analysis of the relationships between the figures.
- Linking Phrases: Basic linking phrases like “In general” or “as for” are used, but they are minimal.
- Opinion and Analysis: There is little to no analysis or summary provided beyond simply describing the data.
Example:
“The most significant reason for people moving to a European country was to accompany their family, accounting for 25%.”
Why it’s Band 6.0-6.5: The writer follows the task requirements but lacks complexity in language and interpretation, which keeps the response limited to a basic description.
2. Band 7.0-7.5:
- Language: More varied sentence structures are used here, including complex and compound sentences. The vocabulary is more advanced than in the Band 6.0-6.5 version but still not as sophisticated as the Band 8.0-8.5 version.
- Details and Comparison: This version starts to compare the data more actively and includes linking phrases to show relationships between the figures in a more natural way. There’s more emphasis on contrasting and grouping the reasons.
- Linking Phrases: Phrases like “On the other hand,” “A close second,” and “However” are used to transition between ideas and make comparisons.
- Opinion and Analysis: The writer gives a more structured and in-depth analysis of the data, highlighting trends and drawing simple conclusions.
Example:
“On the other hand, the largest portion of emigrants left the European country for a definite job, with 38% choosing this option.”
Why it’s Band 7.0-7.5: The language is more flexible, and the content reflects a stronger ability to compare and contrast data, providing some analysis and interpretation of the data.
3. Band 8.0-8.5:
- Language: This version employs sophisticated sentence structures and a wide range of vocabulary. The writing is more complex and polished, with more use of advanced vocabulary and idiomatic expressions.
- Details and Insight: The data is described with greater depth, and the analysis goes beyond just reporting the numbers. There is clear insight into the meaning of the figures, with more attention paid to the subtle differences and trends.
- Linking Phrases: A greater variety of linking devices like “Conversely,” “In contrast to,” and “Interestingly” are used to connect ideas in a cohesive way.
- Opinion and Analysis: This version draws clear conclusions from the data, providing deeper interpretation. The writer also makes a clearer distinction between immigration and emigration, offering a higher level of analysis by mentioning “employment was the predominant driving factor.”
Example:
“In conclusion, employment was the predominant driving factor for both immigration and emigration, though family ties and educational goals also significantly influenced people’s decisions.”
Why it’s Band 8.0-8.5: This version shows a high level of fluency and flexibility in using English. The analysis of the data is well-developed, with clear comparisons, detailed conclusions, and a high level of precision in language.
Summary of Differences:
- Band 6.0-6.5: Focuses more on reporting the data with little comparison or deeper analysis. Simple vocabulary and sentence structures are used.
- Band 7.0-7.5: Shows more variation in sentence structure and begins to compare the data actively. More analysis is included, but the vocabulary and complexity are moderate.
- Band 8.0-8.5: Uses a wide range of vocabulary and advanced sentence structures. Provides a detailed analysis of the data, with clear insights and interpretations. The language is polished and fluent.
Discover more from Viva English Academy
Subscribe to get the latest posts sent to your email.
