Giải chi tiết đề thi thật IELTS Writing 2024 – Từ Band 6.0 đến 8.5
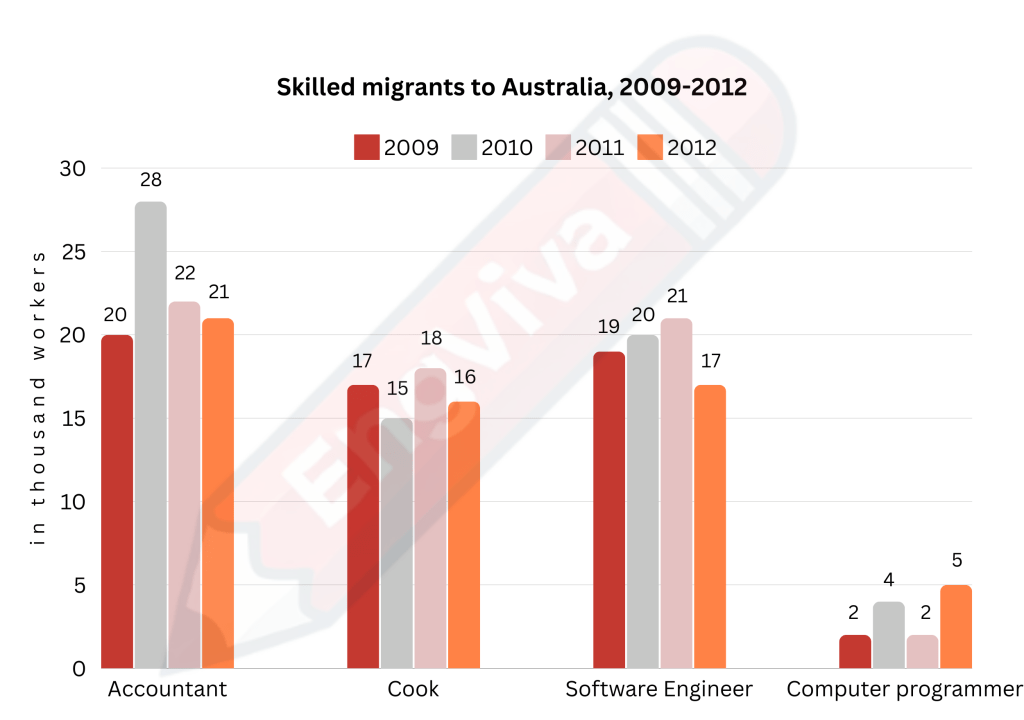
Task 1: The chart below gives information on the numbers of workers in different occupations who migrated to Australia between 2009 and 2012.
Summarise the information by selecting and reporting the main features, and make comparisons where relevant.
Band 6.0-6.5 Version:
The bar chart illustrates the number of skilled workers who migrated to Australia in four different occupations from 2009 to 2012. The professions include accountants, cooks, software engineers, and computer programmers.
Overall, accountants and software engineers had the highest number of skilled migrants throughout the period, while computer programmers had the least. In 2009, 20,000 accountants migrated to Australia, which increased to 28,000 in 2011 before slightly declining to 21,000 in 2012. Similarly, software engineers saw a rise from 19,000 in 2009 to a peak of 21,000 in 2011, followed by a drop to 17,000 in 2012.
Cooks, on the other hand, experienced a more stable trend, with a slight increase from 17,000 in 2009 to 18,000 in 2012. However, computer programmers had significantly lower numbers, with only 2,000 in 2009, remaining the same until 2011, and a small rise to 5,000 in 2012.
In conclusion, while accountants and software engineers consistently dominated migration numbers, computer programmers were the least represented group over the four-year period.
Band 7.0-7.5 Version:
The bar chart provides data on the number of skilled migrants to Australia from 2009 to 2012, specifically focusing on four professions: accountants, cooks, software engineers, and computer programmers.
In general, accountants and software engineers had the largest number of skilled migrants over the four-year span. In 2009, approximately 20,000 accountants migrated, and this figure peaked at 28,000 in 2011, before a decline to 21,000 in 2012. A similar pattern is observed for software engineers, whose migration numbers grew from 19,000 in 2009 to a high of 21,000 in 2011, then dropped to 17,000 in 2012.
The migration figures for cooks were relatively stable, fluctuating between 15,000 and 18,000 over the period. In contrast, computer programmers consistently represented the lowest number of migrants, starting at 2,000 in 2009 and remaining at that level until 2011, when the figure rose slightly to 5,000 in 2012.
In summary, the data suggests that accounting and software engineering were the most popular professions for skilled migration to Australia during the period, while computer programming consistently lagged behind.
Band 8.0-8.5 Version:
The bar chart illustrates the number of skilled workers migrating to Australia in four key professions—accountants, cooks, software engineers, and computer programmers—over the period from 2009 to 2012.
The data reveals that accountants and software engineers consistently had the highest migration rates, whereas computer programmers lagged far behind. In 2009, 20,000 accountants migrated to Australia, a number that rose sharply to 28,000 in 2011 before falling to 21,000 in 2012. Software engineers followed a similar trajectory, increasing from 19,000 in 2009 to a peak of 21,000 in 2011, but then declining to 17,000 by 2012.
Migration figures for cooks were relatively stable throughout the four years, fluctuating slightly from 15,000 to 18,000. In contrast, the number of computer programmers remained low, with only 2,000 in 2009 and 2010, followed by a modest increase to 5,000 by 2012.
Overall, accountants and software engineers were the dominant professions among skilled migrants to Australia, while computer programmers consistently accounted for the smallest share of migrants over the period.
Breakdown of Differences:
- Complexity of Vocabulary:
- 6.0-6.5: Uses simpler vocabulary and sentence structures, such as “had the least” and “slightly declining.”
- 7.0-7.5: Introduces slightly more complex vocabulary, such as “provides data” and “relatively stable.”
- 8.0-8.5: Uses more advanced vocabulary and precise terms, like “trajectory,” “modest increase,” and “dominant professions.”
- Sentence Structure:
- 6.0-6.5: Predominantly simple sentence structures with some compound sentences.
- 7.0-7.5: A mix of compound and complex sentences, providing more variety and better flow.
- 8.0-8.5: More complex sentences and a broader range of grammatical structures, making the text more sophisticated.
- Clarity and Cohesion:
- 6.0-6.5: Clear but with less emphasis on cohesion devices (e.g., linking words).
- 7.0-7.5: Increased use of linking devices such as “however,” “similarly,” and “in contrast,” enhancing the flow between sentences.
- 8.0-8.5: Highly cohesive with seamless transitions between ideas, and the use of more nuanced language for comparison.
- Details and Precision:
- 6.0-6.5: General statements without much detail (e.g., “a rise” or “a drop”).
- 7.0-7.5: More precise details are given (e.g., “a high of 28,000”).
- 8.0-8.5: Greater precision and a more analytical approach, highlighting not only the figures but also the trends and trajectories in detail.
Discover more from Viva English Academy
Subscribe to get the latest posts sent to your email.
