Giải chi tiết đề thi thật IELTS Writing 2024 – Từ Band 6.0 đến 8.5
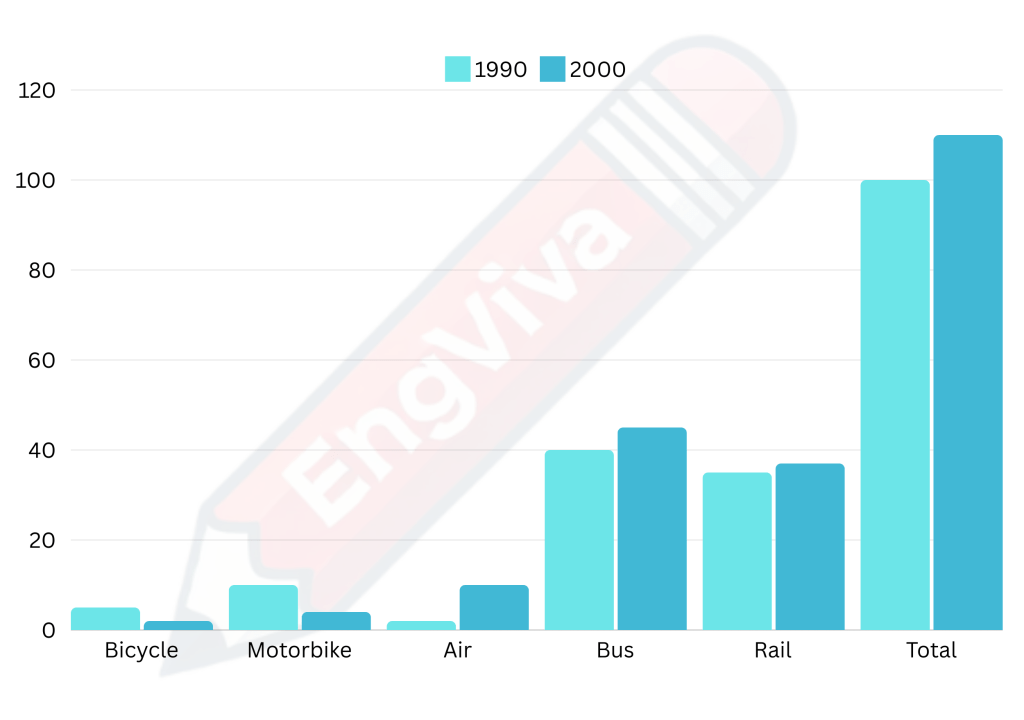
Task 1: The chart shows the total distance travelled by passengers on five types of transport in the UK between 1990 and 2000.
Band 6.0 – 6.5 Version:
The bar chart illustrates the total distance traveled by passengers using five different types of transport in the UK in 1990 and 2000. The modes of transport include bicycles, motorbikes, air, buses, and trains, with the total distance for all methods also included.
In 1990, buses were the most common means of transport, with passengers traveling around 70 units of distance. Railways followed closely behind with approximately 50 units. Motorbikes, bicycles, and air travel had the least distance covered, all under 10 units. In contrast, the total distance for all transport modes was just over 100 units.
By 2000, the pattern had changed. Although buses still held the top spot, the distance traveled by passengers in airplanes increased significantly, surpassing the figures for rail. Interestingly, total travel distance rose to over 100 units by 2000.
In summary, air travel and total distances saw a substantial rise, while buses remained a popular mode of transport during this period.
Band 7.0 – 7.5 Version:
The bar chart compares the total distance traveled by passengers on five different types of transport in the UK between 1990 and 2000. The categories of transport include bicycles, motorbikes, air, buses, and rail, with the overall total distance also depicted.
In 1990, buses were the most widely used, accounting for roughly 70 units of travel, while trains followed at around 50 units. Bicycles, motorbikes, and air travel all had minimal usage, with each below 10 units. Meanwhile, the total distance traveled across all methods stood at just over 100 units.
By 2000, air travel had risen significantly, nearly doubling from its previous figure and overtaking rail travel. Buses continued to lead, though the gap narrowed. The total travel distance for all transport modes climbed to nearly 120 units, indicating an increase in travel overall.
In conclusion, air travel experienced the most notable growth, while buses maintained their position as the primary mode of transport throughout the decade.
Band 8.0 – 8.5 Version:
The bar chart provides a comparison of the total distance traveled by passengers on five modes of transport in the UK between 1990 and 2000. The types of transport include bicycles, motorbikes, air, buses, and rail, with the total distance for all methods also displayed.
In 1990, the bus was the most widely used form of transport, with around 70 units of distance traveled. Rail followed, with approximately 50 units, while motorbikes, bicycles, and air travel were used far less, each accounting for fewer than 10 units. The total distance traveled across all forms of transport was slightly over 100 units.
By 2000, air travel had surged dramatically, overtaking rail to become the second most-used form of transport. While buses remained the most popular mode of travel, their dominance had decreased slightly. The total distance traveled by all forms of transport increased to nearly 120 units, reflecting a broader rise in passenger mobility during the decade.
Overall, the chart highlights a significant shift toward air travel, while buses continued to be a dominant mode of transport throughout the period.
Here’s a breakdown of why each version is rated at the specific IELTS band levels:
Band 6.0 – 6.5 Version:
Reasons for Band 6.0 – 6.5:
- Task Achievement: The essay provides a clear description of the data and addresses the key trends shown in the chart. However, it lacks depth in comparing the data and does not explore detailed comparisons, which limits its completeness.
- Coherence and Cohesion: The structure is logical and the ideas are presented clearly. However, the transitions between ideas could be smoother, and there is minimal use of complex linking devices (e.g., “in contrast” is used, but more could improve the score).
- Lexical Resource: The vocabulary used is appropriate, but it is relatively simple and lacks variety. There are few attempts at using less common or more precise language, which would be expected in higher bands.
- Grammatical Range and Accuracy: Simple sentence structures are used, with a few instances of compound sentences. However, the grammar is basic, and the use of complex structures is limited. The accuracy is generally good, but more complex grammatical forms are needed for higher bands.
Band 7.0 – 7.5 Version:
Reasons for Band 7.0 – 7.5:
- Task Achievement: The description is more thorough compared to the Band 6.0 version. It highlights the main trends in the data and provides more detailed comparisons between the years. However, there is still room for more in-depth analysis.
- Coherence and Cohesion: There is clear progression in ideas, and more cohesive devices are used (e.g., “meanwhile,” “in conclusion,” “the gap narrowed”), which helps link the ideas smoothly. The flow of the text is more natural.
- Lexical Resource: There is a wider range of vocabulary, and it’s used more flexibly. The essay includes phrases like “widely used,” “accounting for,” and “minimal usage,” which reflect a more advanced level of word choice and variety.
- Grammatical Range and Accuracy: The grammatical structures are more varied, with both simple and compound sentences used effectively. There are more instances of complex structures (e.g., “while buses continued to lead, though the gap narrowed”), showing a better command of sentence complexity. There are few if any grammatical errors.
Band 8.0 – 8.5 Version:
Reasons for Band 8.0 – 8.5:
- Task Achievement: This version provides a detailed and well-rounded response to the task. It not only describes the data accurately but also offers insightful comparisons between the years. The description is fully developed, with no key points omitted.
- Coherence and Cohesion: The text is cohesive and flows naturally, with sophisticated transitions and linking words such as “surged dramatically,” “reflecting a broader rise,” and “highlights a significant shift.” Ideas are logically sequenced and fully linked.
- Lexical Resource: The range of vocabulary is extensive and used with flexibility. There is a strong use of higher-level vocabulary, such as “dominance had decreased,” “surged dramatically,” “passenger mobility,” and “overtaking rail.” These words show a command of more advanced language suited to Band 8+.
- Grammatical Range and Accuracy: There is a wide range of grammatical structures, from simple sentences to complex ones. Phrases like “while buses remained the most popular mode of travel, their dominance had decreased slightly” demonstrate effective use of complex grammar. The accuracy is excellent, with no noticeable errors, which is expected for this band level.
Key Differences Across the Versions:
- Task Achievement: The higher the band, the more detailed and analytical the response becomes. Band 6.0 focuses more on basic descriptions, while Band 8.0 includes a more in-depth analysis of trends and changes over time.
- Coherence and Cohesion: Higher bands show smoother transitions, with more complex and natural use of linking words. The progression of ideas is clearer and more logical in higher band versions.
- Lexical Resource: Band 6.0 uses basic vocabulary, while Band 8.0 demonstrates a broader range of sophisticated and precise vocabulary. Band 7.0 falls between the two, showing some complexity but not as much range or flexibility as Band 8.0.
- Grammatical Range and Accuracy: The higher the band, the more varied and accurate the grammatical structures. Bands 7.0 and 8.0 feature more complex sentence forms and fewer grammatical errors, while Band 6.0 tends to rely on simpler sentence structures with limited complexity.
These elements collectively explain why each version is awarded its respective score.
Discover more from Viva English Academy
Subscribe to get the latest posts sent to your email.
