Summarise the information by selecting and reporting the main features, and make comparisons where relevant. Write at least 150 word
IELTS Academic Writing Task 1 Topics October & November 2024
Band 6.0-6.5
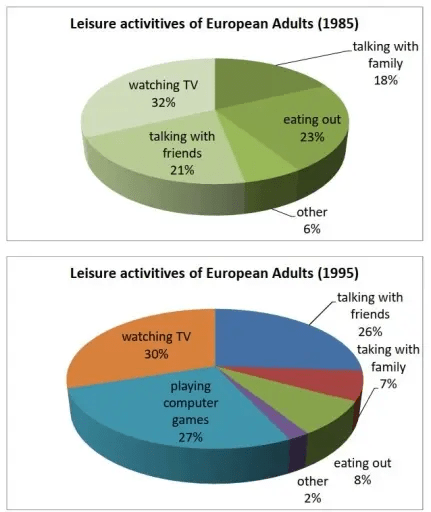
The two pie charts show the results of a survey on the popularity of different leisure activities among European adults in 1985 and 1995.
Overall, watching TV was the most popular activity in both years, while there were significant changes in the popularity of other activities, particularly eating out and playing computer games.
In 1985, the majority of people spent their free time watching TV, accounting for 32% of the total. Eating out was the second most common activity, at 23%, followed by talking with friends at 21%. Talking with family and other activities made up the rest, with 18% and 6%, respectively.
By 1995, some significant changes had occurred. Watching TV remained the most popular activity, though its proportion decreased slightly to 30%. Playing computer games emerged as a new popular activity, taking 27% of the total. Meanwhile, eating out and talking with family declined sharply to 8% and 7%, respectively. Talking with friends increased to 26%.
Band 7.0-7.5
The two pie charts compare the results of a survey on the leisure activities of European adults in 1985 and 1995.
Overall, watching TV remained the most popular activity in both years, though some significant changes occurred, including a decline in eating out and a rise in playing computer games.
In 1985, 32% of European adults spent their free time watching TV, making it the most popular activity. Eating out was the second most popular choice at 23%, followed by talking with friends at 21%. Smaller proportions of people engaged in talking with family (18%) or other activities (6%).
By 1995, the landscape had shifted. Watching TV, though still the most popular, decreased slightly to 30%. A new category, playing computer games, became the second most common leisure activity, accounting for 27% of the total. Eating out and talking with family saw sharp declines, falling to 8% and 7%, respectively. Meanwhile, talking with friends gained popularity, rising to 26%.
Overall, the period saw the rise of modern activities like computer games and a decline in traditional pastimes such as eating out and family conversations.
Band 8.0-8.5
The two pie charts illustrate the results of a survey on the leisure activities of European adults in 1985 and 1995, highlighting changes in the popularity of various activities over the decade.
It is evident that watching TV remained the dominant leisure activity in both years, though notable shifts occurred in other areas, particularly the rise of playing computer games and the decline in activities like eating out and talking with family.
In 1985, the most popular activity was watching TV, which accounted for 32% of Europeans’ leisure time. Eating out and talking with friends were also common activities, representing 23% and 21% of the total, respectively. Smaller percentages were dedicated to talking with family (18%) and other activities (6%).
By 1995, the rise of technology significantly altered leisure habits. While watching TV still accounted for the largest share at 30%, playing computer games emerged as a major new activity, occupying 27% of leisure time. In contrast, eating out dropped dramatically to just 8%, and talking with family saw a similar decline to 7%. However, talking with friends increased, rising to 26%.
These changes reflect the growing influence of technology on leisure habits, with computer games becoming a major pastime while traditional social activities declined.
Discover more from Viva English Academy
Subscribe to get the latest posts sent to your email.
