Summarise the information by selecting and reporting the main features, and make comparisons where relevant. You should write at least 150 words.
IELTS Academic Writing Task 1 Topics October & November 2024
Band 6.0-6.5
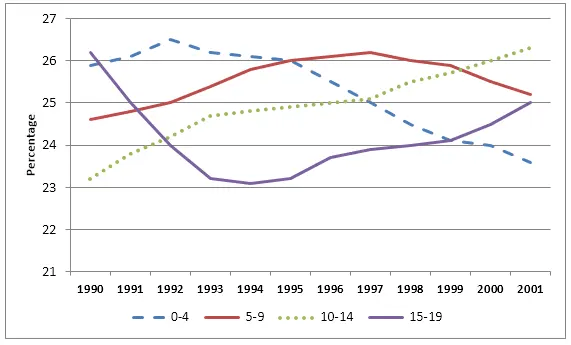
The line graph shows the percentages of children in different age groups as part of the young population in the United Kingdom from 1990 to 2001. The age groups are 0-4, 5-9, 10-14, and 15-19 years old.
Overall, the percentages of children in the 0-4 and 5-9 age groups declined during this period, while the proportion of those in the 10-14 and 15-19 age groups rose.
In 1990, the percentage of children aged 0-4 was the highest, at around 26%, but it steadily dropped to about 23% by 2001. Similarly, the 5-9 age group showed a downward trend from 25% in 1990 to just over 24% in 2001.
On the other hand, children aged 10-14 made up less than 24% in 1990, but this figure increased to about 26% by 2001, making it the highest percentage at the end of the period. The 15-19 age group also showed a slight increase from 1990 to 2001, reaching over 24%.
Band 7.0-7.5
The line graph depicts the percentages of children in four age groups—0-4, 5-9, 10-14, and 15-19—as part of the young population in the United Kingdom between 1990 and 2001.
Overall, the graph shows that the proportion of younger children (0-4 and 5-9 years old) steadily declined, while the percentage of older children (10-14 and 15-19 years old) experienced growth throughout the given period.
In 1990, the 0-4 age group had the highest percentage, at nearly 27%. However, this figure decreased consistently over the next decade, falling to just above 23% by 2001. Similarly, the 5-9 age group dropped slightly from around 25% in 1990 to just under 24% by the end of the period.
Conversely, the 10-14 age group saw a noticeable rise, growing from 23% in 1990 to over 26% by 2001, becoming the most significant age group by the end of the period. The 15-19 age group also rose, albeit more gradually, increasing from 23% to just above 24% by 2001.
Band 8.0-8.5
The line graph illustrates the percentage of children across four age groups—0-4, 5-9, 10-14, and 15-19—relative to the young population in the United Kingdom from 1990 to 2001.
Overall, there was a clear shift in the distribution of children across age groups during the period, with younger age groups (0-4 and 5-9 years) declining in proportion, while the older age groups (10-14 and 15-19 years) increased.
In 1990, children aged 0-4 made up the largest portion of the young population, at just under 27%. However, this figure steadily declined over the years, reaching its lowest point of approximately 23% by 2001. Similarly, the 5-9 age group also saw a decline, though less pronounced, from around 25% in 1990 to slightly below 24% by 2001.
On the other hand, the 10-14 age group witnessed a significant rise from 23% in 1990 to over 26% by 2001, making it the dominant age group by the end of the period. The 15-19 age group also experienced an increase, growing from 23% to just above 24%, but its growth was more gradual compared to the 10-14 age group.
In conclusion, the data reveals a clear trend of younger age groups shrinking in proportion, while older age groups became more prominent over the 11-year period.
Discover more from Viva English Academy
Subscribe to get the latest posts sent to your email.
